Email A/B Testing: Design, Sample Size, and Statistical Significance
A performance marketer presents a subject line test to the team. One variation beat the other by 18% after three hours on a list of 400 people. Everyone celebrates. The next week, a follow-up test reverses the result. The week after that, a third test is inconclusive. The team stops testing. The problem was never the subject lines. The problem was math done too early on too few people. That sequence plays out in marketing teams across every industry every week, and it has nothing to do with how good the campaigns are.
Key Findings
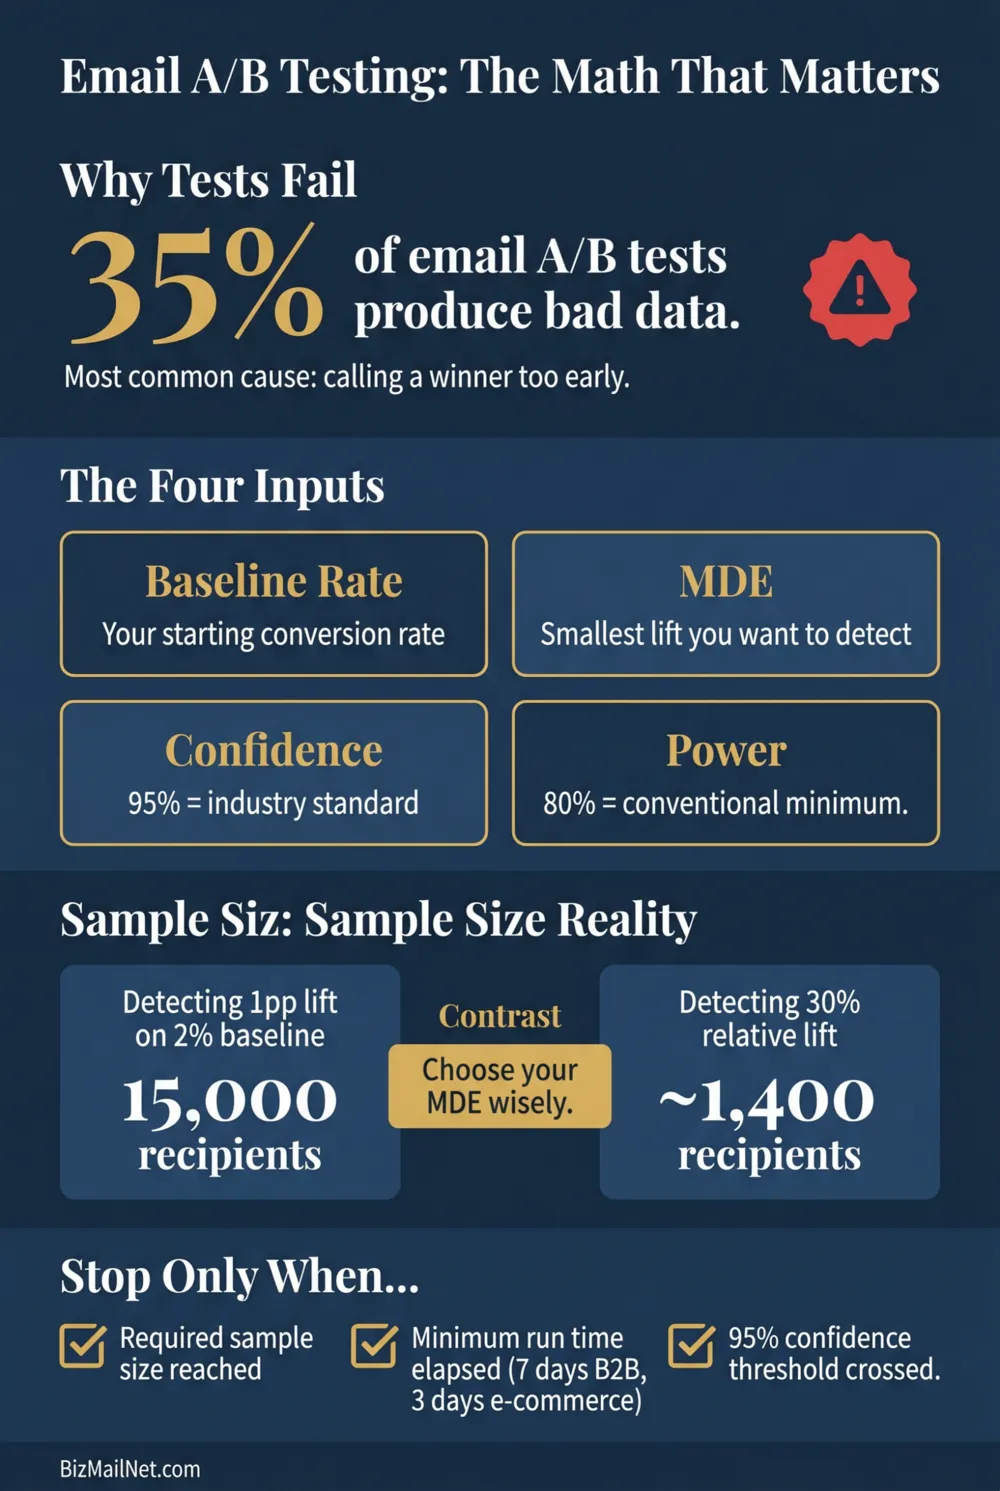
- 35% of all email A/B tests fail due to methodology errors, most commonly calling a winner before the math allows it. 52.8% of conversion rate optimizers have no defined stopping criteria at all. (Mailmend, 2026)
- Properly structured testing produces an average 83% ROI lift and a 29% downstream conversion improvement. The gap between structured and unstructured testing is not marginal. (Mailmend, 2026)
- Detecting a 1 percentage point lift on a 2% baseline conversion rate requires roughly 15,000 total recipients to validate at 95% confidence. Most SMB email lists cannot run that test. Test larger effects that require smaller samples instead.
- A statistically validated email subject line and offer is the cheapest possible creative test before committing to a direct mail print run. The cost of running the wrong creative on 10,000 physical pieces dwarfs what an email test costs.
Why 35% of Email A/B Tests Produce Bad Data
Calling a winner on an A/B test before it has enough data does not produce a wrong result occasionally. It produces a wrong result most of the time. Statistical noise looks exactly like a real signal at small sample sizes. A variant that leads by five clicks after two hours on a list of 500 people is not winning. It just happened to get slightly more clicks in a window that is too narrow to mean anything.
The damage is not just one bad decision. Acting on false positives trains teams to expect testing to produce contradictory results, because that is what underpowered tests produce. After enough contradictory results, the team abandons testing entirely. This is the standard arc: test sporadically, call winners too early, get conflicting data, conclude that testing does not work, stop testing. The 83% average ROI lift from properly structured testing goes uncaptured permanently because the methodology was wrong from the start.
The fix is not complicated. It requires knowing three things before a test launches: how many recipients each variation needs, how long the test has to run, and at what threshold you will call a result. None of those decisions should happen during the test. All three should be set in advance.
HubSpot's data science team documented a controlled experiment where a 0.53% validated improvement in open rates (a number that looks trivially small) generated 131 highly qualified incremental leads for the company. The number is only trivially small if the sample size is too small to validate it. At scale, small validated improvements compound in ways that unvalidated "wins" never do.
The Four Inputs That Determine Required Sample Size
Required sample size is a calculation, not a judgment call. Four variables determine how many recipients each variation needs before a result can be trusted.
1. Baseline Conversion Rate
The current conversion rate you are trying to improve. If your email-to-purchase conversion rate is 2%, that is your baseline. This number matters because a smaller baseline rate requires more observations to detect a given absolute change. A 1 percentage point improvement on a 2% baseline is a 50% relative increase, which requires substantial sample size because each individual conversion event is rare at that rate.
2. Minimum Detectable Effect (MDE)
The smallest improvement you want to be able to detect as real rather than random. Most teams set this too low. An MDE of 1 percentage point on a 2% baseline requires approximately 15,000 total recipients. An MDE of 30% relative improvement on the same baseline requires far fewer, potentially under 2,000 per variation. The MDE is the most powerful lever for making testing viable on a small list. Choose a high MDE, test for large differences only, and the required sample size drops to something achievable.
3. Statistical Significance Level
The threshold at which you are willing to accept that a result is real. 95% is the standard. It means you would expect to see a difference this large by chance only 5% of the time. Some teams use 90% for faster decisions with more risk tolerance. Going below 90% means more than 1 in 10 test conclusions will be wrong simply due to chance, which is too many for any operational use of the results.
4. Statistical Power
The probability that the test will detect a real effect when one exists. 80% is the convention. It means that if a real improvement of your MDE actually exists, you will detect it 80% of the time. Setting power too low means real improvements go undetected (false negatives), which is particularly costly when you are testing large, fundamental changes that actually do work but the test was not powered to see them.
AB Tasty's data science team frames the stakes plainly. A sample size too small produces misleading results. One too large wastes time and budget waiting for significance on an effect that was already obvious. Setting the correct sample size upfront means you stop exactly when you need to. Not before, not after.
What to Test When Your List Is Under 2,000 Subscribers
A list of 2,000 subscribers cannot run a standard A/B test on minor variations. The math simply does not allow it. Testing two subject line word choices on 1,000 people per variation produces results that are indistinguishable from random noise at any reasonable confidence level. Running that test and acting on it is not data-driven marketing. It is guessing with extra steps.
The correct approach is not to wait until the list is large enough to test minor variations. It is to test things that are large enough to detect on the list you have.
Large effects require small samples. A completely plain-text email against a fully designed HTML campaign does not produce a 1 percentage point difference in conversion rate. It produces a difference that may be 20%, 30%, or 40% relative to the baseline, depending on the audience. That is a large MDE. A test designed to detect a 30% relative improvement on a 2% baseline needs roughly 700 to 900 recipients per variation at 95% confidence, which is viable on a 2,000-person list.
What counts as a large enough difference to test on a small list:
- Plain text email versus fully designed HTML template
- One offer versus a completely different offer (free trial versus 20% discount; resource download versus demo invitation)
- Short email (under 150 words) versus long email (over 500 words)
- Single CTA versus multiple CTAs
- Personalized sender name versus company name in the From field
What does not count as a large enough difference for a small list:
- Two subject line word variations ("Get started today" versus "Start today")
- Button color changes
- Image placement differences within the same template
- Minor copy tweaks within the same message architecture
Small list testing requires discipline to resist. Minor variations feel testable because they are easy to produce. But easy to produce does not mean possible to validate on 1,000 people per group. Spending time testing something that cannot produce a valid result is worse than not testing at all, because it creates false data that may get acted on.
Test Design: What to Actually Test
Even on lists large enough to run standard tests, not all tests produce equally useful information. The value of a test result is proportional to the size and durability of the decision it informs.
Subject Line Testing
The most commonly run email test and frequently the least valuable at SMB scale. Subject line differences that drive material changes in open rates rarely produce the downstream conversion changes that justify the testing overhead, particularly since Apple's Mail Privacy Protection has inflated open rates enough to make them unreliable. If you test subject lines, measure CTR as the outcome, not opens, and accept that you will need a large list to reach significance on differences that subject line tests typically produce.
Offer Testing
The highest-value test for most SMBs. Two fundamentally different offers (a free trial versus a resource download, a product discount versus free shipping, a webinar invitation versus a direct demo booking) produce large behavioral differences that are detectable on smaller samples and carry information that directly shapes what goes into the next campaign, the next direct mail piece, and the next landing page. A confirmed offer winner is actionable across every channel at once.
Send Time Testing
Requires enough volume to run two populations in parallel rather than sequentially. Sequential send-time tests confound results with whatever else changed between the two sends: news events, day of week effects, prior email fatigue. Valid send time testing requires splitting a single send into two randomized groups that receive the same email at different times on the same day. At low list volumes, the statistical power to detect send-time differences is limited unless those differences are large (morning versus evening, weekday versus weekend).
Format Testing
Plain text versus HTML is the highest-signal format test available and the one most likely to produce a detectable result on a small list. Many B2B audiences respond better to plain text. Many e-commerce audiences respond better to image-heavy HTML. The correct answer for your specific audience is worth knowing, and it is testable on lists that cannot support subject line testing. Run this test once, document the result, and let it inform every subsequent campaign format decision.
Stopping Criteria: When to Call a Winner
52.8% of conversion rate optimizers have no defined stopping criteria. That number explains why so many test results contradict each other. Without a stopping rule set in advance, tests end when someone decides they have been running long enough, which is almost always earlier than the math requires and later than patience allows.
Three conditions must all be true before a test result can be called:
Required sample size per variation has been reached. This number comes from the pre-test calculation using the four inputs above. It is fixed at test launch and does not change because one variant is leading. A variation leading by 30% after reaching 20% of the required sample size is not a valid winner. It is noise that looks like a winner.
Minimum run time has elapsed. For B2B email, a minimum of 7 days accounts for the different behavior patterns across weekdays and weekends, the difference between how a contact behaves on Monday morning versus Thursday afternoon, and the natural variation in how quickly different recipients open and act on email. For e-commerce, 3 days is the minimum. Running a test for less time than this introduces day-of-week bias that can produce false winners even at adequate sample sizes.
Statistical significance threshold has been crossed. If your pre-set threshold is 95% and the current significance reading is 91%, the test has not finished. Leave it running. If significance never crosses the threshold after the full sample size and run time requirements are met, the result is inconclusive. The test could not detect a difference of the MDE at the confidence level you set. That is a valid result. It means either the effect does not exist or it is smaller than your MDE, and you can act on that information accordingly.
Setting these three criteria before the test launches matters because it removes the temptation to make a judgment call mid-test. Watching one variation lead early and holding back from declaring a winner is genuinely difficult. Pre-committed stopping rules make the decision automatic rather than discretionary.
For teams building out their CRM revenue tracking to measure what happens after the click, the CRM revenue tracking guide covers how HubSpot, ActiveCampaign, and Klaviyo each handle downstream conversion attribution differently, and which platform you can actually use to measure A/B test outcomes at the deal level. which platform you can actually use to measure A/B test outcomes at the deal level.
Email as a Creative Lab for Direct Mail
Every dollar of risk in direct mail creative is avoidable. A print run of 10,000 postcards costs thousands in printing, postage, and fulfillment. If the headline and offer are wrong, there is no recall, no swap, no A/B test after the fact. The pieces go out and either the offer resonates or it does not.
Email is the cheapest creative lab available for reducing that risk before the print order is placed.
A statistically valid email A/B test on offer A versus offer B costs the time to write two variations and the ESP cost of the send. If offer B beats offer A by 40% in CTR at 95% confidence on a properly sized sample, that result is actionable information about what your audience responds to. Put offer B on the postcard. The cost of running the wrong offer on 10,000 physical pieces, in print waste, postage waste, and lost response rate, is multiple orders of magnitude higher than the cost of the email test that would have identified the winner first.
The same logic applies to subject lines as headline copy. A validated email subject line that drives a real CTR improvement will, in most cases, drive a comparable response rate improvement as a postcard headline or letter opener. The medium is different. The underlying question the audience is answering (whether this message is worth my time) is the same.
The workflow: run the email test to statistical completion, document the winner, take the winning subject line and offer directly into the direct mail brief. The email test does not add weeks to the timeline. It removes weeks of guesswork and revision from the physical creative process by arriving at the brief with a validated starting point rather than a hypothesis.
For the full attribution picture connecting email and direct mail outcomes back to a single GA4 view, the email marketing ROI measurement guide covers the matchback and UTM methodology that makes cross-channel attribution work.
Sample Size Calculator
Enter your current conversion rate, the minimum improvement you want to detect, and your confidence level. The calculator outputs the recipients per variation required to run a valid test, plus a plain-language verdict on whether that number is achievable on your list.
FAQ
It depends on what you are trying to detect. Testing for a 1 percentage point lift on a 2% baseline conversion rate requires roughly 15,000 total recipients at 95% confidence and 80% statistical power. If your list is under 2,000, standard A/B testing on minor variations is not viable. Test large, fundamental differences instead (plain text versus HTML, or one offer versus a completely different one) that produce a larger minimum detectable effect and require far fewer recipients to validate.
Statistical significance measures how confident you can be that the difference you observed between variations is real and not random noise. A 95% significance threshold means you would expect to see a difference this large by chance only 5% of the time. A result has not crossed the significance threshold until enough recipients have been exposed to both variations and enough time has elapsed for the test to run through a complete behavioral cycle. Calling a winner at two hours based on early click counts produces false positives far more often than real results.
The minimum detectable effect (MDE) is the smallest improvement you want to be able to detect as real. A smaller MDE requires a larger sample. An MDE of 1 percentage point on a 2% baseline requires roughly 15,000 total recipients. An MDE of 30% relative improvement on the same baseline needs far fewer. For SMBs with small lists, choosing a high MDE and testing for large, obvious differences is the only mathematically valid approach.
Three conditions must all be met: the required sample size per variation has been reached, the minimum run time has elapsed (7 days for B2B, 3 days for e-commerce), and statistical significance has crossed your pre-set threshold. Never stop because one variation is leading early. Pre-set all three stopping conditions before the test launches so the decision is automatic rather than a judgment call made while watching live data.
Yes. A subject line and offer combination validated by a proper A/B test is the cheapest possible creative validation before committing to a physical mail run. Printing 10,000 postcards with a headline and offer that lost a digital A/B test wastes print, postage, and fulfillment costs that far exceed what the email test cost. Run the digital test first. Apply the winning combination to the physical piece.
Sources
- Mailmend. A/B Testing Email: Statistical Significance and Sample Size Guide. 2026. mailmend.io (vendor source)
- HubSpot. A/B Testing: A Complete Guide. 2026. hubspot.com (vendor source)
- AB Tasty. Statistical Power and Sample Size in A/B Testing. 2026. abtasty.com
- Reddit. r/Emailmarketing. Frustrations with A/B test methodology at small list sizes. 2026. reddit.com (anecdotal)