Email Marketing Benchmarks by Industry 2026: Open Rates, CTR, and Conversions
Every quarter, a marketing team gets asked: "Is our open rate good?" The question sounds simple. The answer is not, because open rates are now unreliable across every industry due to Apple's Mail Privacy Protection pre-fetching. CTR and revenue per recipient are the metrics worth comparing. The benchmarks below give you both, with the context needed to explain them to anyone who still asks about open rates.
Key Findings
- Apple's Mail Privacy Protection has inflated open rates across every industry since 2021. The 2026 benchmarks are directionally useful but contain machine-triggered inflation of an unknown proportion. CTR and CTOR are the reliable comparators. (Digital Applied, 2026)
- Average email list growth slowed to 4% going into 2026, down from 6% in prior years. Top-performing programs have responded by moving from list growth optimization to revenue-per-recipient efficiency. (Digital Applied, 2026)
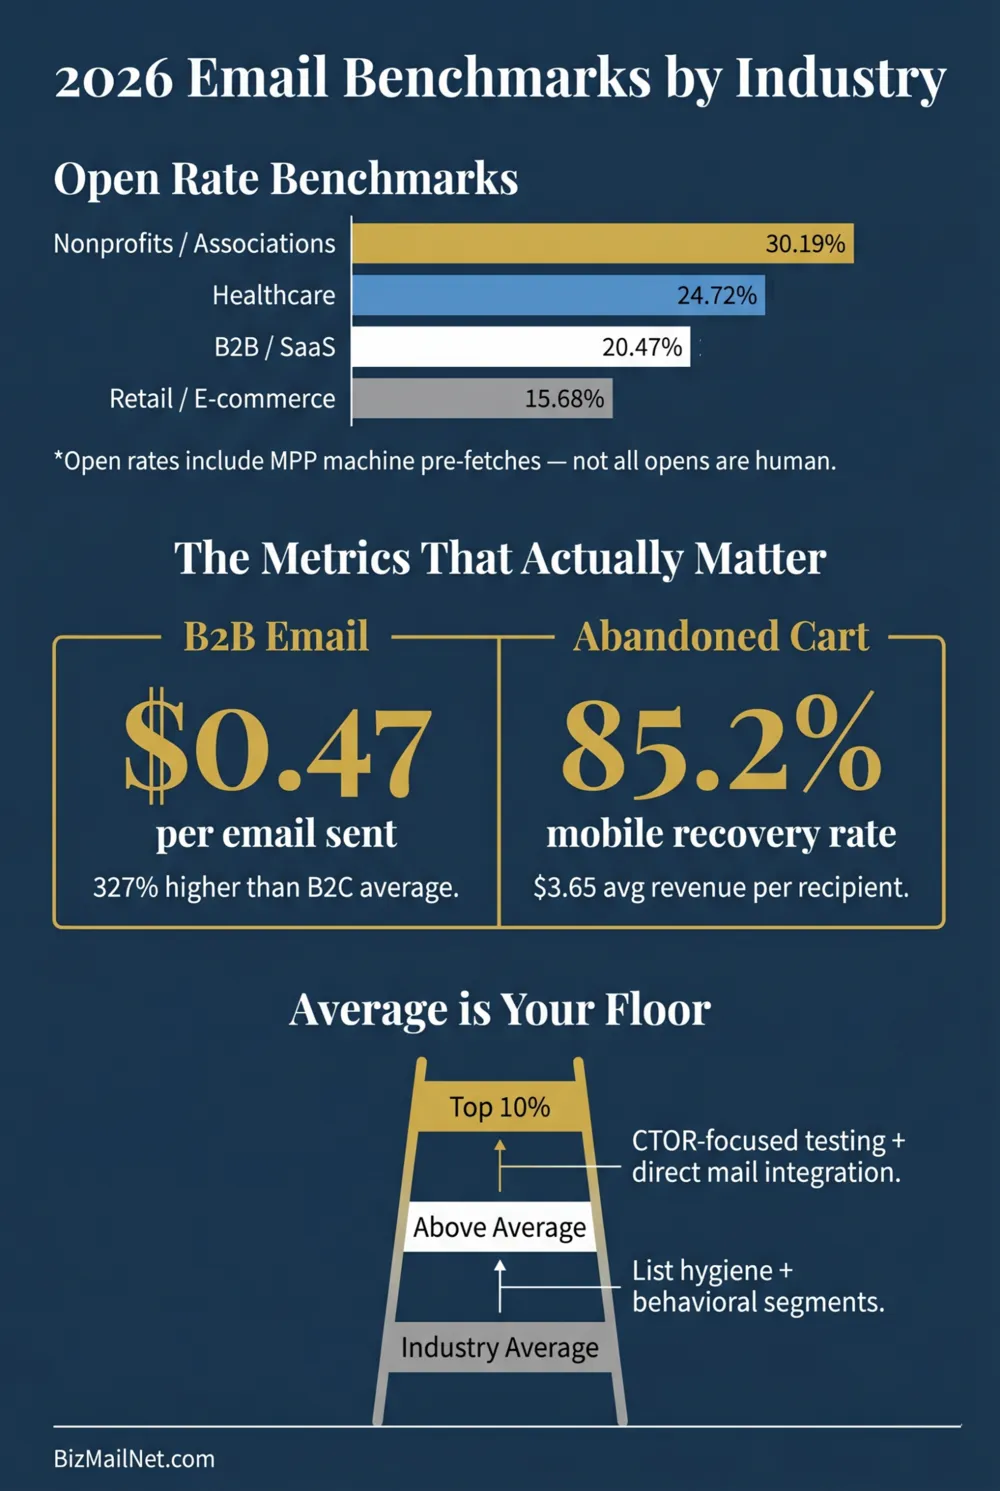
- Retail abandoned cart flows recover at 70% on desktop and 85.2% on mobile. B2B email generates $0.47 per email sent on average, 327% higher than B2C. Comparing the two sectors on open rates is a category error. (Digital Applied, 2026)
- Only 35% of nonprofits remove unengaged subscribers regularly. The remaining 65% are paying inflated platform costs for contacts that actively depress their deliverability scores. (Digital Applied, 2026)
Why Open Rate Benchmarks Are Unreliable in 2026
Apple released Mail Privacy Protection in September 2021. When a recipient using Apple Mail opens the app, iOS pre-fetches email content including any embedded tracking pixel, recording an open signal whether or not the person actually read the email. By 2026, this behavior has compounded through five years of adoption growth across iPhones, iPads, and Mac Mail clients.
The practical effect: any open rate figure from 2022 onwards contains an unknown proportion of machine-triggered events. A B2B list with heavy Apple Mail usage may show 20% opens when the real human open rate is 12%. A nonprofit list with a donor base skewed toward older demographics, who disproportionately use Apple Mail, may show 35% opens with a real rate closer to 18%.
DMARC enforcement tightening by Google and Yahoo in Q1 2024, maintained through 2026, has further reset the baseline for deliverability. Domains without proper DMARC, DKIM, and SPF configuration see reduced inbox placement rates regardless of engagement history. This means some portion of benchmark-level open rates reflects sends that are already experiencing partial spam folder routing, making the published averages even less useful as targets for programs with clean authentication in place.
None of this means open rates are worthless. Within a single list over time, open rate trends reveal whether the audience relationship is improving or deteriorating. What open rates cannot do is serve as a cross-industry performance standard when the denominator contains machine events and the numerator is affected by deliverability issues that vary by domain and platform.
Open Rate Benchmarks by Sector
The numbers below come from Digital Applied and Higher Logic 2026 research. Each carries the MPP caveat. Use them for directional context and trend comparison, not as hard targets.
| Industry | Average Open Rate | MPP Inflation Risk | Better Metric |
|---|---|---|---|
| Nonprofits and Associations | 26.84–33.54% | High (older donor demographics, high Apple Mail usage) | Donation conversion rate per send |
| Healthcare and Medical | 24.72% | Medium-High | Appointment booking rate, click-to-form completion |
| B2B / Technology / SaaS | 20.47% | Medium (mixed device environment) | CTR, demo booking rate, revenue per recipient |
| Retail and E-commerce | 15.68% | Lower (purchase events are trackable) | Purchase conversion rate, abandoned cart recovery rate |
| All Industries (Average) | 21.33–23.44% | Varies by list composition | CTOR, revenue per email sent |
The nonprofit range is the widest in the table for two reasons. First, nonprofit email audiences skew toward demographics with high Apple Mail adoption, which inflates the open rate most severely. Second, smaller, highly targeted nonprofit lists genuinely do outperform larger broadcast lists on engagement. The Higher Logic Annual Report found that subject lines under 40 characters combined with personalized content consistently produced stronger engagement than broad distribution sends, regardless of list size.
The retail figure looks low relative to other sectors but is the most operationally honest number in the table, because e-commerce programs track purchase events rather than open signals as their primary KPI. A retail program with 15% opens and a 4% CTR driving $3.65 average revenue per abandoned cart recipient is outperforming a nonprofit with 30% opens and a 1.2% CTR on every metric that drives organizational revenue.
CTR and CTOR: The Reliable Indicators
Click-through rate (CTR) measures clicks as a percentage of total emails sent. It is affected by deliverability (emails that land in spam never get opened or clicked), by list quality (unengaged contacts suppress the rate), and by content relevance. It is not affected by MPP, because a click requires a deliberate human action.
Click-to-open rate (CTOR) measures clicks as a percentage of opens rather than total sends. The MPP inflation that sits in the open rate denominator also sits in the CTOR denominator, so the ratio partially cancels the noise. CTOR tells you how compelling the email content was for the people who saw it, which is a more precise measure of creative and messaging effectiveness than CTR against total sends.
The practitioner consensus from r/b2bmarketing frames the measurement shift plainly: pundits claim email is dead while the data shows it is the highest ROI channel. The disconnect is that generic drip sequences feel like noise to mid-market buyers and produce CTRs that look like failure on industry benchmarks. Signal-based targeting (sending to contacts based on behavioral triggers rather than arbitrary schedule) produces CTRs that look like outliers against the same benchmarks.
A B2B program should benchmark its performance in this order: CTR first (is the content driving clicks from recipients who see it?), CTOR second (of the people who open, how many are clicking?), and revenue per recipient third (are the clicks converting to meetings, trials, or closed deals?). Open rate is the last metric to examine and the first to explain away when presenting to leadership.
Conversion Rate and Revenue Per Email by Sector
Revenue per email sent is the metric that survives both the MPP problem and the cross-industry comparison problem. It measures what actually ends up in the bank relative to how many sends went out, which is the question every marketing budget conversation eventually reaches.
| Sector | Key Conversion Metric | Benchmark Figure | Source |
|---|---|---|---|
| B2B / SaaS | Revenue per email sent | $0.47 average (327% higher than B2C) | Digital Applied, 2026 |
| Retail: Abandoned Cart | Cart recovery rate | 70% desktop, 85.2% mobile | Digital Applied, 2026 |
| E-commerce: Behavioral Flows | Revenue per recipient | $1.94 (flows) vs. $0.11 (broadcasts) | Klaviyo Benchmark, 2026 |
| Nonprofits | Donation conversion rate | Higher Logic reports targeted lists outperform broadcast by 2–3x | Higher Logic Annual Report, 2026 |
The abandoned cart recovery rates for retail deserve specific attention. 70% on desktop and 85.2% on mobile. An automated flow firing within 30 minutes of cart abandonment recovers the majority of those transactions. No broadcast campaign achieves that recovery rate because no broadcast campaign intercepts the contact at the exact moment of documented purchasing intent. This is why Klaviyo's benchmark of $1.94 per recipient for behavioral flows versus $0.11 for manual broadcasts is so stark. The timing mechanism, not the email copy, is doing the work.
For B2B programs, the $0.47 per email sent figure requires proper attribution to show up in reports. If UTM parameters are misconfigured, GA4 attributes the conversion to direct traffic and the email program appears to generate nothing. The full setup for making these numbers visible is in the UTM naming conventions guide and the email marketing ROI measurement guide.
Retail vs. B2B: Why the Benchmarks Are Incomparable
A retail marketing manager with a 16% open rate and a B2B marketing manager with a 20% open rate are not in the same conversation. Their programs serve different purchasing behaviors, different sales cycles, and different revenue models. Putting both sets of numbers in the same benchmark table and drawing cross-sector conclusions produces guidance that is wrong for both audiences.
Retail email works on volume and timing. A consumer database of 200,000 contacts with 15% opens and 2% CTR generates 60,000 opens and 4,000 clicks per campaign. The abandoned cart automation that fires within 30 minutes of a cart event does not care about the average open rate. It cares about the latency between the cart event and the first email send, the personalization of the product recommendation, and the offer in email two if email one does not convert.
B2B email works on precision and nurture depth. A B2B list of 5,000 contacts with 20% opens and 2.5% CTR generates 1,000 opens and 125 clicks. If those 125 contacts are the right 125, and the emails moved them through an evaluation process that resulted in three closed deals at $50,000 each, the program generated $150,000 from 5,000 sends. The revenue per email sent is $30. The open rate is 20%.
The practitioner on r/b2bmarketing who noted that generic drip sequences feel like noise to mid-market buyers is describing the B2B equivalent of the retail volume problem. A B2B program that sends weekly newsletters to 5,000 contacts regardless of where each contact sits in the evaluation process is running a broadcast model on an audience that requires a precision model. The benchmark numbers reflect the output of the precision model, not the broadcast model. Programs optimized for open rates rarely match the benchmarks for revenue per recipient.
How to Beat Your Industry Benchmark
Three actions reliably move email program metrics above the industry average, and none of them involve changing the subject line.
List Hygiene
Only 35% of nonprofits remove unengaged subscribers regularly. The other 65% are mailing contacts who are not opening, not clicking, and actively suppressing the engagement rate that all benchmarks are calculated against. Removing them does not just improve deliverability. It mathematically improves CTR and CTOR because the denominator shrinks while the numerator stays the same. A list of 10,000 contacts generating 200 clicks at 2% CTR that removes 3,000 unengaged contacts now shows the same 200 clicks at a 2.86% CTR against the 7,000-contact active list.
Before removing anyone, the correct sequence is suppression, then re-engagement sequence, then deletion. The list hygiene strategy guide covers the full framework. Unengaged digital contacts are also candidates for a direct mail trigger rather than permanent deletion. A postcard to a physical address is unaffected by inbox algorithms and reaches the contact regardless of whether they have been ignoring email for six months.
Behavioral Segmentation
Automated behavioral flows generate 41% of total email results from 5.3% of total sends. The revenue per recipient gap between flows ($1.94) and manual broadcasts ($0.11) is not explained by better copywriting. It is explained by timing: a flow triggered by a specific behavioral event reaches a contact at a moment of documented intent. A broadcast reaches everyone at an arbitrary scheduled time regardless of where they are in a decision process.
For B2B programs, the behavioral triggers that matter are pricing page visits, integration documentation views, webinar registrations, and trial activations. For e-commerce, they are cart additions, browse abandonment, purchase completions, and post-purchase time intervals. Building the six core segments and the flows connected to them is a one-time investment that produces output 24 hours a day without additional campaign scheduling.
CTOR-Focused Creative Testing
Optimizing subject lines for open rates optimizes a corrupted metric. A subject line that generates an 8% higher open rate due to curiosity clicks but produces no change in CTR is not a winner. It is more opens with the same number of clicks, which means a lower CTOR and no additional output. Testing for CTOR improvement forces the creative process to answer a better question: what makes someone who opened the email want to click the link? That is a content and offer question, not a subject line question.
The framework for running A/B tests that produce valid CTOR data, including the sample size requirements and stopping criteria, is in the email A/B testing sample sizes guide.
Interactive Benchmark Dashboard
Select your industry and enter your current metrics. The dashboard shows where your program sits on the 2026 percentile curve and flags which specific metric needs the most attention.
FAQ
Industry averages run from 15.68% for retail e-commerce to 26–33% for nonprofits, with B2B and SaaS landing around 20.47%. Apple's Mail Privacy Protection has inflated these figures by an unknown proportion. A more useful frame: if your open rate is within 3 to 5 percentage points of your industry average, the metric is not the problem. If your CTR is below 1.5% in B2B or below 1% in retail, the content and targeting need attention regardless of what the open rate shows.
CTOR measures clicks as a percentage of opens rather than total sends. The MPP inflation that sits in the open rate denominator also sits in the CTOR denominator, so the ratio partially cancels the noise. CTOR reflects how compelling the email content was for people who saw it, which is a more precise measure of creative effectiveness than raw CTR against total sends where deliverability, list quality, and machine events all affect the number.
The industry average CTR for B2B email sits around 2.1% in 2026. A CTR consistently above 3% puts a program in the top-performing tier. CTR below 1.5% indicates a content relevance or targeting issue. The diagnostic sequence: confirm the list is segmented by behavioral signals, confirm the CTA is singular and specific, and confirm the email is arriving in the primary inbox before attributing low CTR to creative weakness.
Yes. The 2026 B2B and SaaS industry average sits at 20.47%. A 20% open rate is exactly at benchmark. The relevant follow-up question is whether that 20% is generating a CTR above 2% and whether those clicks are converting to trials, demos, or paid accounts. A 20% open rate with a 0.8% CTR is underperforming on content. A 20% open rate with a 3.5% CTR and measurable downstream conversions is a healthy program regardless of whether the open rate looks impressive on its own.
Reframe the conversation around revenue per recipient. B2B email generates an average of $0.47 per email sent, 327% higher than B2C averages. Present open rate in context: "Our 20% open rate aligns with the 2026 B2B industry average of 20.47%. Our CTR of 2.8% is above average. The metric that matters is revenue per recipient, which is tracking at $0.52 against a $0.47 industry benchmark." That framing is defensible against any executive question about whether the open rate is good enough.
Sources
- Digital Applied. Email Marketing Statistics and Benchmarks 2026. 2026. digitalapplied.com (vendor source)
- Higher Logic. Annual Community and Email Benchmark Report 2025–2026. 2026. higherlogic.com
- Klaviyo. Email Benchmark Report. 2026. klaviyo.com (vendor source)
- Reddit. r/b2bmarketing. Email ROI measurement discussion: long sales cycle tracking. 2026. reddit.com (anecdotal)