Email Marketing ROI: Attribution, Measurement, and Revenue Impact
The email platform says 50 conversions. Meta says 150. GA4 shows 40. None of those numbers are wrong. They are each answering a different question with a different ruleset, which makes it nearly impossible to justify budget, optimize spend, or prove that any specific campaign drove real revenue. This guide covers the attribution models, tracking setup, and measurement frameworks that turn conflicting platform reports into a number you can actually defend.
Key Findings
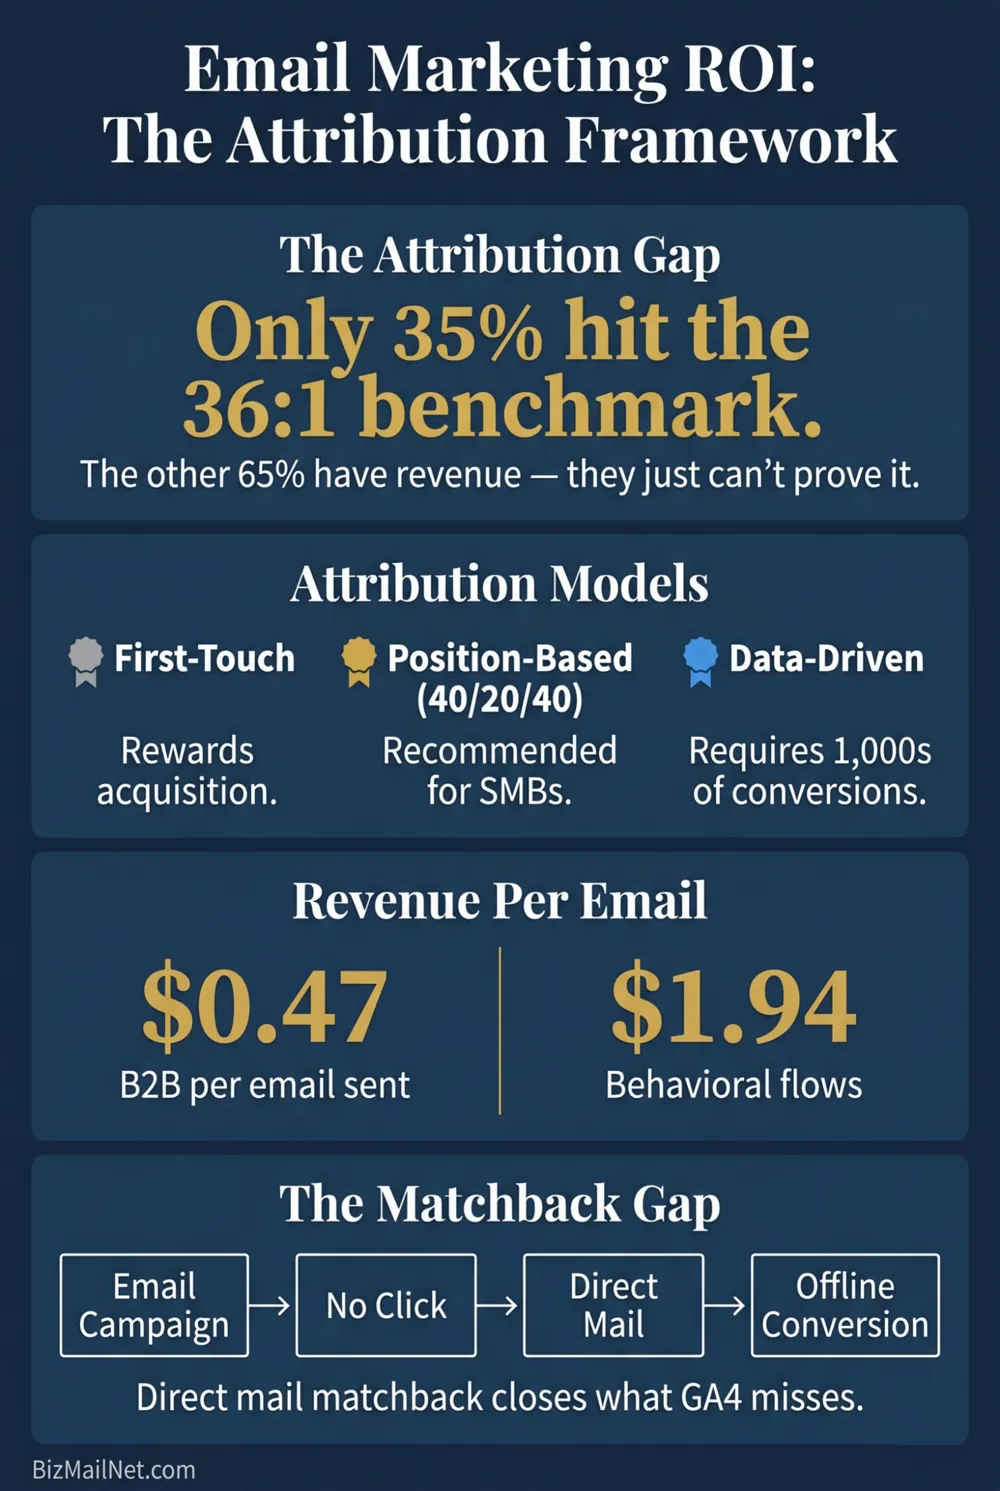
- Only 35% of companies hit the widely cited 36:1 email ROI benchmark. Most miss it not because email underperforms but because attribution is misconfigured. The results that did happen are credited to other channels. (Litmus, 2026)
- 78% of email results are generated by triggered behavioral flows, not manual broadcast campaigns. If broadcasts are doing the majority of your volume, the ROI ceiling is structurally limited before any attribution work begins. (Digital Applied, 2026)
- B2B email generates an average of $0.47 per email sent (327% higher than B2C). That figure only appears in your reports if the tracking is configured correctly from send to close. (Digital Applied, 2026)
- Direct mail matchback analysis now closes the attribution gap that digital tracking cannot reach. Contacts who converted after receiving physical mail but without a digital click are invisible to GA4 without a matchback protocol in place.
The $36-to-$1 Stat and the Attribution Gap Behind It
The average email marketing ROI of $36 to $45 per $1 spent is real. It comes from WSI World's 2026 research and holds up across multiple independent studies. The problem is not the number. The problem is what it measures: average channel performance across all companies using email, not the marginal return from any specific campaign decision a particular team is making.
A team that sees a $4 ROI is not necessarily running bad campaigns. They may be running good campaigns with broken attribution. The revenue that did happen got credited to organic search or direct traffic because the UTMs were missing or the conversion window was misconfigured. A team showing a $60 ROI may be over-counting, pulling in view-through conversions from a 30-day platform window that GA4 would attribute elsewhere.
Bot-driven phantom engagement has compounded the problem. Open rates have been unreliable since Apple's Mail Privacy Protection pre-fetching began inflating them in 2021. By 2026, multi-channel attribution tracking and MQL measurement jumped 22% year-over-year as teams abandoned open-rate reporting entirely and moved toward revenue per recipient, list churn rate, and customer lifetime value as the core accountability metrics. The shift is not optional for teams presenting email performance to executive leadership. A CFO who asks "what did this campaign generate?" and receives an open rate in reply will not fund the next campaign.
What follows is the measurement framework for getting from platform dashboard noise to defensible revenue numbers.
Why Platform Data and GA4 Never Agree
Platform attribution and GA4 attribution disagree by design. They are not measuring the same thing. Understanding what each one is actually counting is the prerequisite for using either number correctly.
Most email platforms apply a 30-day post-click attribution window. A contact who clicks an email link on May 1 and converts on May 28 gets credited to email in the platform dashboard. The same conversion may appear in GA4 as direct traffic if the contact closed the browser after clicking and returned to the site 27 days later through a new session typed directly into the address bar. The email platform is not wrong. GA4 is not wrong. They are counting different user journeys.
The fragmentation gets worse when paid channels run alongside email. An ad platform might show 150 conversions from a given week. GA4 attributes 40 of those to paid. The email platform claims 50. Direct traffic in GA4 absorbs the remainder because the ad click and the email click both happened in the window, and GA4's last-click model gave credit to whichever session immediately preceded the conversion event. Every platform claims the same conversion. Nobody is lying. The attribution models just disagree on who deserves the credit.
The practical resolution: pick one source of truth for budget decisions and apply it consistently. GA4 is the correct choice for cross-channel decisions because it is the only source that sees all traffic from all channels simultaneously. Platform dashboards (email, social, search) are useful for comparing campaigns against each other within a single channel. They are not reliable inputs for deciding how to split a budget across channels.
The secondary resolution: accept the gap and document it. A team that presents "email platform shows $120k, GA4 shows $80k, we use GA4 for budget decisions and monitor the platform for relative campaign performance" is doing attribution correctly. The gap is not a problem to be solved. It is a feature of multi-platform marketing that needs to be explained rather than hidden.
Attribution Models: First-Touch, Last-Touch, and Multi-Touch
Attribution models decide which touchpoints in a customer journey get credit for a conversion. The choice of model changes the apparent ROI of every channel in a marketing mix, which means it changes every budget decision downstream from it.
Last-Touch Attribution
Last-touch gives 100% of conversion credit to the final touchpoint before the conversion event. This is GA4's default model. It consistently over-rewards organic search and direct traffic because those tend to be the final steps in a buying journey that email nurturing moved along through the middle. A contact who received six email newsletters over three months, clicked through twice, and then searched for the brand directly before purchasing generates zero email attribution credit in a last-touch model. The organic search session gets everything.
Last-touch is not worthless. It is accurate for measuring which channel closes, which is useful information for conversion rate optimization. It is misleading for measuring which channels create demand and move buyers through the funnel.
First-Touch Attribution
First-touch gives 100% of conversion credit to the first recorded touchpoint. This systematically over-rewards acquisition channels (paid search, paid social, organic search) that bring contacts into the database, while ignoring the email nurture that kept them engaged for three months until they were ready to buy. A useful model for understanding which channels acquire buyers. Not useful for understanding which channels convert them.
Multi-Touch Attribution
Multi-touch distributes credit across all recorded touchpoints in a journey. The specific distribution varies by model type:
Linear: Equal credit to every touchpoint. Simple to calculate, tends to under-credit high-value touchpoints and over-credit low-value ones.
Position-based (U-shaped): 40% credit to first touch, 20% distributed proportionally across all middle touches, 40% to last touch. This is the practical standard for SMBs without access to machine-learning attribution platforms. It balances acquisition credit with conversion credit and does not require volume thresholds that most SMB lists cannot reach.
Data-driven: Machine learning distributes credit based on observed conversion probability at each touchpoint across thousands of journeys. Requires substantial conversion volume, typically thousands of conversions per month, to produce statistically reliable distributions. Below that threshold, the model produces overfitted results that are no more accurate than position-based.
For SMBs choosing a model today: start with position-based in GA4. Configure a custom attribution model under Admin → Attribution Settings → Attribution model. Apply it consistently across all reporting views. Revisit the model choice annually as conversion volume grows. Do not switch models mid-year and compare results across the switch. The numbers become incomparable and the historical data loses its value.
UTM Parameter Strategy for Email
Every link in every email needs a UTM. Without them, clicks that land on the website get absorbed into direct traffic in GA4, and the campaign that generated the visit disappears from the attribution record entirely. This is the single most common source of the gap between platform-reported email results and GA4-reported email results.
GA4 maps sessions to default channels using the exact strings in the UTM medium parameter. utm_medium=email maps correctly to the Email default channel. utm_medium=Email, utm_medium=e-mail, and utm_medium=newsletter all fall to Unassigned or Other. One capital letter wipes the attribution for every click from that campaign.
The governance requirement: a shared taxonomy document that specifies all approved parameter values, enforces lowercase throughout, and requires that every campaign link be generated through a single approved URL builder before it goes into the email template. A team where individual members type UTM strings by hand into campaign builders will produce fragmented data within 60 days. A team with a documented taxonomy and a single builder will produce clean data for the life of the program.
The full build guide for UTM governance, including the GA4 channel grouping rules, the exact strings that work, and the template for a taxonomy document, is in the UTM naming conventions guide.
Cohort Analysis: Measuring Email's Long-Tail Revenue Impact
Campaign-level reporting answers the question "what did this send produce in the next 30 days?" Cohort analysis answers a different question: "what did contacts who first engaged with email in a given month go on to generate over the following six months?"
The distinction matters because email's value is disproportionately long-tail. A contact who clicks a newsletter in January, does nothing for three months, and then converts in April after a product launch email. Campaign-level reports show zero value from the January newsletter. Cohort analysis shows the January acquisition cohort eventually converting at a rate that includes the April buyer, attributing the revenue correctly to the nurture program, not just the final push.
The practical setup in GA4 uses the Explore module. Create a cohort exploration report with "First user source/medium contains email" as the cohort definition, retention metric set to conversions or purchase revenue, and a six-month lookback window. The resulting table shows cohort-by-cohort revenue accumulation over time, making the compounding effect of email nurture visible in the data rather than invisible in the last-touch default view.
This reporting approach also catches a category of revenue that no platform dashboard ever shows: the repeat customer. A contact who converted from email in Q1 and re-purchased in Q3 without clicking any marketing touchpoint before the second transaction will show up as a direct purchase in Q3. Cohort analysis ties them back to the Q1 email acquisition event and shows the lifetime value of that original click.
SMS + Email Cross-Channel Attribution
When SMS runs alongside email on the same list, attribution gets complicated in a specific way. Both channels are opt-in, both are direct, and both often run on the same platform with similar timing. A contact who receives an email on Tuesday and an SMS on Wednesday and converts on Thursday generates a double-attribution problem: the email platform claims credit for the email, the SMS platform or the same platform's SMS module claims credit for the text, and GA4 attributes the session to whichever UTM-tagged link the contact clicked most recently.
The correct resolution is not adjusting the attribution window or changing the model. It is running a suppression-based incrementality test. Split the audience randomly into three groups: email only, SMS only, and a no-contact control. Run the campaign for a defined window, then compare conversion rates across the three groups against the control. The lift from email only versus the control shows the true incremental value of the email channel. The lift from SMS only shows the same for SMS. The overlap between the two tells you whether they are genuinely additive or whether one channel is generating most of the lift and the other is along for the ride.
This structure requires enough volume to produce statistically valid results, typically at least 1,000 contacts per group for a detectable effect on conversion rates above 2%. For smaller lists, run the test on the highest-value segment only and extrapolate cautiously. The goal is directional accuracy, not academic precision.
Slazenger's 2026 case data shows what properly measured omnichannel attribution produces when the setup is done correctly: 49x ROI and a 700% increase in customer acquisition from real-time, behavior-driven campaigns with precise attribution tracking. Avon Beauty documented a 78% increase in conversion rates for segmented campaigns by unifying online and offline touchpoints into complete customer profiles. Both outcomes required the measurement infrastructure to be correct before the optimization could produce those numbers.
A/B Testing and Statistical Validity
A/B test results that are not statistically valid produce false positives. Acting on false positives optimizes campaigns in the wrong direction. The team runs the same test again the following week with a contradictory result, loses confidence in testing entirely, and stops doing it. This is the most common outcome of email A/B testing at SMB scale. Not because testing does not work, but because the tests are being called before the math allows it.
Testing a subject line variation on a list of 500 people for three hours is not a test. It is a guess with extra steps. Detecting a 1 percentage point lift on a 2% baseline conversion rate (a 50% relative improvement) requires roughly 15,000 total recipients to validate at 95% confidence and 80% statistical power. Most SMB lists cannot run that test cleanly. The correct response is not to stop testing. It is to test larger effects, which require smaller samples. Pitting a completely plain-text email against a fully designed HTML version requires far fewer recipients to detect a winner than comparing two subject line word choices.
The full sample size framework, including the four inputs that determine required volume, the correct stopping criteria, and the specific test designs that work for small lists, is in the email A/B testing sample sizes guide.
CPA Benchmarking by Industry: What Strong Email ROI Looks Like in 2026
Cross-industry email benchmarks are directionally useful and operationally misleading. A retail e-commerce team celebrating a 15% open rate and a B2B SaaS team panicking over a 20% open rate are both using the wrong metric to evaluate performance that cannot be compared across those business models in the first place.
| Industry | Avg. Open Rate | Avg. CTR | Revenue Signal |
|---|---|---|---|
| Nonprofits | 26–34% | 2.6% | High response rate, lower average transaction value |
| Healthcare | 24.7% | 2.2% | High compliance constraints limit automation depth |
| B2B / SaaS | 20.5% | 2.1% | $0.47 per email (highest per-email revenue of any sector) |
| Retail / E-commerce | 15.7% | 1.9% | Volume-dependent; abandoned cart flows average $3.65 per recipient |
Every open rate in that table carries the MPP caveat. Apple's Mail Privacy Protection has been inflating open rates through machine pre-fetching since 2021. The exact inflation proportion varies by audience demographics and device mix, but B2B lists with heavy Apple Mail adoption can show open rate inflation of 20 to 40 percentage points above the real human figure. CTR and revenue per recipient are the metrics worth benchmarking. Open rates are useful only for trend analysis within a single list over time, not for cross-industry comparison.
The structural difference between retail and B2B explains why their benchmarks are incomparable. Retail wins on volume and automation depth: abandoned cart flows average $3.65 per recipient, and top performers hit $28.89. B2B wins on revenue per email and lifetime deal value: a single closed deal from an email-nurtured contact can produce a $0.47 per-email average even when a campaign sends to 50,000 contacts and only closes three deals. The math works out very differently across those models, and the CPA targets that make sense in each are correspondingly different.
For the full industry-level benchmark data broken down by sector with percentile context, the industry benchmark data guide covers where your current metrics actually fall on the 2026 curve.
How Direct Mail Closes the Attribution Gap
Every attribution model covered in this guide has one shared limitation: it only counts digital touchpoints. A contact who received an email, did not click, received a physical postcard two weeks later, and then converted by walking into a store generates zero tracked revenue for either channel in a standard GA4 setup. The conversion appears as in-store or direct. The email and the postcard both receive no credit, despite being the reason the contact showed up.
Direct mail matchback analysis closes this gap. The process compares the physical mailing list against the conversion database by matching addresses. A contact whose postal address appears in both the sent list and the conversion records within a defined post-mail window gets attributed to the campaign, without requiring any digital click. The same logic applies to email-only programs: compare the email send list against the customer purchase database by email address, and any contact who appeared in the send list and converted within the attribution window gets credited to the email campaign regardless of what GA4's session model recorded.
The offline integration becomes most useful when email and direct mail run in sequence. A segment of email contacts who have not engaged digitally in 90 days is suppressed from broadcast sends, exported for address appending, and mailed a postcard. The postcard carries a QR code linked to a vanity URL with campaign UTMs: utm_medium=direct_mail&utm_source=postcard_q2. When a recipient scans the code, the resulting session appears in GA4 as a tracked direct mail conversion. The matchback protocol then catches the contacts who converted via phone or in-store without scanning at all.
The result is a complete attribution picture across digital email, physical mail, and offline conversion, all tied back to the same campaign event and visible in a single GA4 view alongside the digital data. Chad S. White describes this as connecting activity directly to conversion performance: the email or mail piece that moved a buyer is no longer invisible simply because the buyer's final action happened offline.
The vendors that handle triggered direct mail, address appending, and GA4 matchback integration at SMB scale are reviewed in the direct mail follow-up directory.
Email ROI Calculator
Enter your monthly email metrics. The calculator outputs projected monthly revenue, estimated cost per acquisition per email subscriber, and projected customer lifetime value, each benchmarked against 2026 industry performance tiers.
FAQ
The widely cited industry average runs $36 to $45 per $1 spent, but only 35% of companies actually reach the 36:1 benchmark according to Litmus research. Most SMBs with properly configured tracking and behavioral automation land between 15:1 and 30:1. The key variable is not the platform. It is whether automated triggered flows are generating the majority of results. Behavioral flows generate 78% of email results. If manual broadcast campaigns are doing the majority of the work, the ROI figure is structurally limited regardless of how well the emails are written.
Platform dashboards and GA4 use different attribution windows and models. Most email platforms use a 30-day post-click window and often include view-through conversions. GA4 defaults to last-click, session-scoped attribution. A contact who clicks your email but returns via direct search 10 days later gets credited to email in the platform and to direct traffic in GA4. Both are technically correct. GA4 is the recommended source of truth for cross-channel budget decisions. Platform dashboards are useful for comparing campaigns against each other within email.
For most SMBs, position-based attribution (40% to first touch, 20% distributed across middle touches, 40% to last touch) is the practical standard. It balances acquisition credit with conversion credit without requiring the conversion volume that data-driven multi-touch needs to produce reliable distributions. Configure it in GA4 under Admin, Attribution Settings, Attribution model. Apply consistently across all reporting views and do not switch mid-year.
Two approaches work. The first is call tracking: include a unique phone number per campaign using a platform like CallRail, log calls against the campaign source. The second is matchback analysis: after a campaign, compare the email send list against your customer purchase database by matching email addresses. Any contact who appeared in the send list and converted within a defined window gets attributed to the campaign without requiring a digital click. This is the same methodology used in direct mail attribution and works for any channel where contact identity is known before the send.
Cross-sector CPA averages are not useful because the business models are structurally different. B2B email generates an average of $0.47 per email sent (327% higher than B2C) because a single closed deal carries high lifetime value. E-commerce CPA depends heavily on average order value and purchase frequency. The most useful benchmark is your own email CPA from verified GA4 data compared against your other acquisition channels. Email consistently outperforms paid social and paid search on CPA when behavioral automation is running.
Direct mail closes the attribution gap that purely digital tracking cannot reach. Contacts who converted after receiving a physical piece but without a digital click are invisible to GA4 without additional setup. Direct mail matchback analysis (comparing the mailing list against the conversion database by address) surfaces these offline conversions and assigns them to the correct campaign. Adding a UTM-tagged QR code or vanity URL to the physical piece brings the offline touchpoint into GA4 as a trackable session, closing the loop between physical mail and digital attribution.
Sources
- WSI World. Email Marketing ROI Statistics 2026. 2026. wsiworld.com (vendor source)
- Litmus. State of Email Marketing 2026. 2026. litmus.com (vendor source)
- Digital Applied. Email Marketing Statistics and Benchmarks 2026. 2026. digitalapplied.com (vendor source)
- Mailmend. A/B Testing Email: Statistical Significance Guide. 2026. mailmend.io (vendor source)
- ActiveCampaign. Email Marketing Automation and Revenue Growth. 2026. activecampaign.com (vendor source)